Home>Finance>What is Inflation? Unraveling Its Role in the Economy


Finance
What is Inflation? Unraveling Its Role in the Economy
Published: January 22, 2024
Learn about what inflation really means for the economy and how it affects our daily lives. Unravel the complexities of inflation with this informative blog post.
(Many of the links in this article redirect to a specific reviewed product. Your purchase of these products through affiliate links helps to generate commission for LiveWell, at no extra cost. Learn more)
The Quick Answer: Inflation is a critical concept in the economy, representing the rate at which the general level of prices for goods and services rises, diminishing purchasing power. This article explores inflation’s multifaceted nature, examining its causes, such as demand-pull and cost-push factors, and the ways it’s measured, notably through the Consumer Price Index (CPI). It delves into inflation’s diverse impact on individuals, businesses, and the broader economy, offering insights into managing personal finances amidst inflationary trends. The piece also considers the strategic use of inflation in economic policy and provides practical advice for young adults to navigate and thrive in an inflation-impacted world.
Inflation: It’s More Than Just a Buzzword!
In today’s fast-paced world, where financial news is just a click away, one term often buzzes around like a bee in a garden of economic discussions: Inflation. But what does it really mean for you, the aspiring entrepreneur, the fresh graduate, or the young professional navigating through the early stages of financial independence? This article isn’t just about breaking down a complex economic concept; it’s about connecting the dots between those headlines and your wallet. Let’s dive into the world of inflation, decode its mysteries, and understand why it’s a topic worth your attention.
What is Inflation? Understanding the Invisible Tax

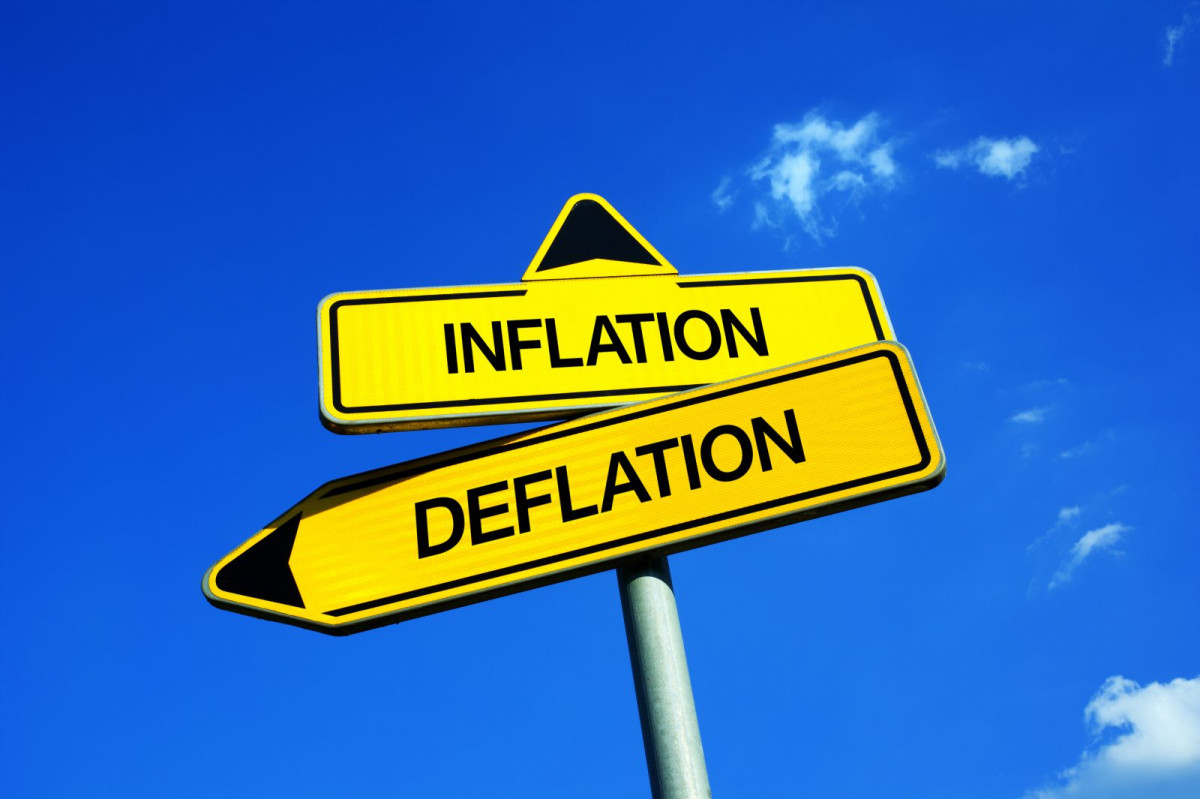
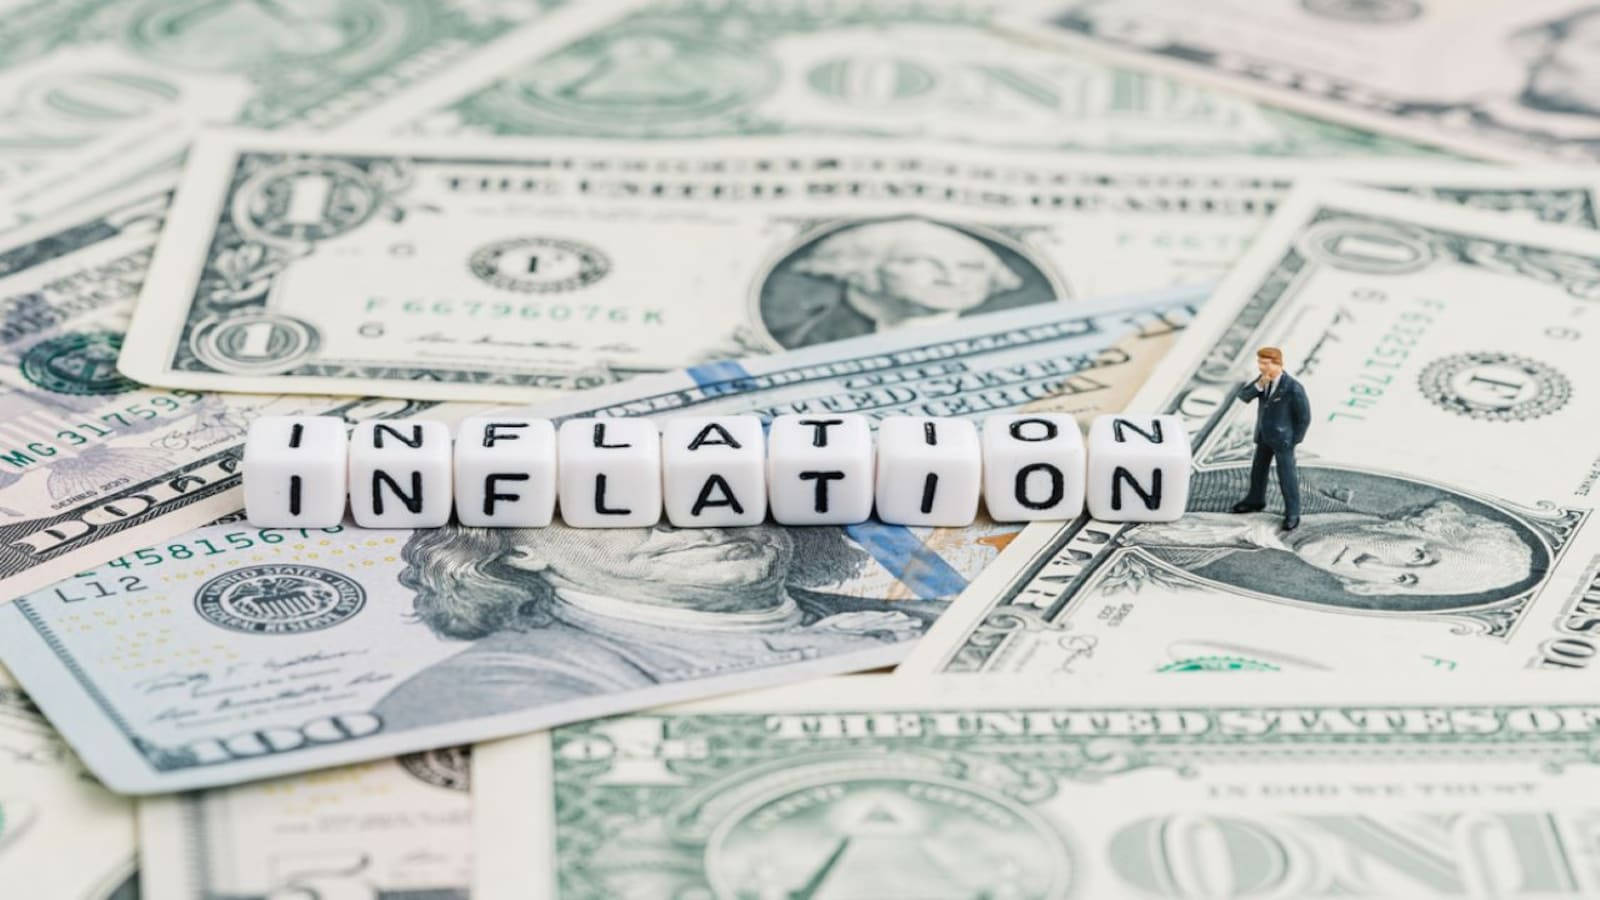
Inflation, in its simplest form, is the rate at which the general level of prices for goods and services is rising, and, subsequently, how purchasing power is falling. Imagine this: last year, your $5 could get you a fancy cup of coffee. This year, it barely covers a regular one. That’s inflation for you – sneaky, silent, but constantly impacting your buying power.
But it’s more than just about your morning coffee. Inflation reflects changes in the economy, signaling various underlying processes. It’s like the economy’s temperature, indicating financial health or hinting at underlying issues. Whether you’re saving for a car, planning your next vacation, or just trying to budget your monthly expenses, understanding inflation is key to navigating your financial landscape.
The Causes of Inflation: The Whys Behind the Rise

So, what causes inflation? It’s a mix of ingredients in the economic pot. Firstly, there’s demand-pull inflation. Picture this: more people want the latest smartphone, but there aren’t enough to go around. The price? Up it goes. Then there’s cost-push inflation, where the cost of making things increases. Think rising oil prices leading to more expensive transport and, therefore, higher prices for goods.
Another player is built-in inflation – this is all about expectations. If people expect prices to go up, they ask for higher wages, which can lead to businesses increasing prices to cover the higher wages, creating a cycle.
Each of these causes affects not just the price tags you see in stores but also the broader economic decisions, like interest rates and government policies. Understanding these can turn you into a savvy consumer and an informed citizen, ready to face the economic waves.
Measuring Inflation: Keeping Score of Prices

Measuring inflation isn’t just a wild guess; it’s a science. The most common tool? The Consumer Price Index (CPI). Think of CPI as a shopping basket filled with a variety of goods and services that ordinary people buy – from your morning latte to your monthly internet bill. By tracking how the prices of these items change over time, economists can get a snapshot of inflation.
But why should you care? Because these figures directly influence policies that affect your life. When inflation rises, central banks might increase interest rates to cool down the economy. This could mean higher loan rates for that new car or home you’ve been eyeing. In short, the CPI isn’t just a number; it’s a number that can change your numbers.
The Impact of Inflation: Inflation and You

Inflation isn’t just an abstract concept; it’s a reality that touches everything from your daily coffee run to your long-term financial goals. For the everyday individual, persistent inflation means your money doesn’t stretch as far as it used to. But it’s not all doom and gloom. For those with loans, inflation can reduce the real value of your debt – your loan payments might feel less burdensome over time.
Businesses aren’t immune either. They face increased costs, which can lead to higher prices and, sometimes, slower growth. For the broader economy, too much inflation can lead to uncertainty, which can deter investment and slow down economic progress.
Inflation and Your Money: Smart Financial Moves

So, how do you stay afloat in an inflationary sea? First, understand that not all investments are created equal in the face of rising prices. Stocks, for example, can be a good hedge against inflation, while cash savings might lose value over time.
Another smart move? Think about diversifying your investments. Don’t put all your eggs in one basket. Consider a mix of stocks, bonds, and other assets. It’s also a great time to brush up on financial literacy. Understanding terms like ‘interest rates’, ‘stock market’, and ‘bonds’ isn’t just for economists – it’s for anyone who earns, spends, or saves money.
Lastly, think about your career and salary. In times of high inflation, your salary needs to keep up. Be ready to negotiate your wages to match the rising cost of living. Remember, staying informed and proactive is the best strategy to ensure that inflation doesn’t erode your financial well-being.
When is Inflation Used? The Upside of Inflation

Inflation isn’t always the villain in our economic story. Sometimes, it’s a tool used by policymakers to stimulate economic growth. When the economy slows down, a moderate level of inflation can encourage spending. Here’s why: if prices are expected to rise, people are more likely to buy now rather than wait, injecting more cash into the economy.
Additionally, inflation can help reduce the real burden of debt – both for governments and individuals. When prices rise, the value of debt stays the same, effectively making it cheaper to repay in the long run. This aspect of inflation can be a silver lining during economic recoveries, especially after recessions.
Coping with Inflation: Your Inflation Survival Guide

Living in an inflationary era doesn’t mean you can’t thrive. Start by revisiting your budget. Focus on needs versus wants, and find areas where you can cut back without sacrificing your quality of life. Another key strategy? Increase your income streams. Whether it’s asking for a raise, taking on freelance work, or investing in upskilling, extra income can help offset the effects of rising prices.
It’s also wise to look into long-term investments that can outpace inflation, like real estate or certain stocks. And don’t forget about emergency savings – having a financial cushion can be a lifesaver when prices fluctuate unpredictably.
The Future of Inflation: Preparing for Tomorrow’s Economy

Predicting the future of inflation is like trying to catch a cloud – it’s complex and ever-changing. However, experts often look at trends in global economies, government policies, and technological advancements to make educated guesses.
For the younger generation, adapting to a potentially fluctuating inflationary environment means staying informed and flexible. Embracing financial education, developing a diverse skill set for the evolving job market, and learning to adapt to changing economic conditions are crucial.
Moreover, technology and innovation can play a pivotal role in shaping the future of inflation. From digital currencies to new forms of investment, staying abreast of technological advancements is key.
As we look towards the future, remember that inflation, like most economic forces, is a wave to ride, not a tide to fear. With the right knowledge and preparation, you can navigate these waters successfully, securing your financial future in an ever-changing world.
Final Thoughts: Embracing Change in Your Financial Journey

As we wrap up our exploration into the world of inflation, it’s clear that this economic phenomenon is more than just a headline or a fleeting concern. It’s a dynamic factor that plays a significant role in our daily lives and long-term financial plans. From understanding what drives price changes to adapting your budget and investment strategies, being inflation-aware can make a substantial difference.
Remember, inflation isn’t just a challenge; it’s an opportunity to grow, learn, and adapt. Whether you’re a budding entrepreneur, a recent graduate entering the workforce, or a young professional scaling the career ladder, your journey will be shaped by how well you navigate the economic landscape, inflation included.
Stay curious, stay informed, and most importantly, stay proactive in managing your finances. With the right mindset and strategies, you can turn the tides of inflation to your advantage, securing a prosperous and financially sound future. So, embrace the change, make informed decisions, and let your financial savvy lead the way in this ever-evolving economic adventure.
